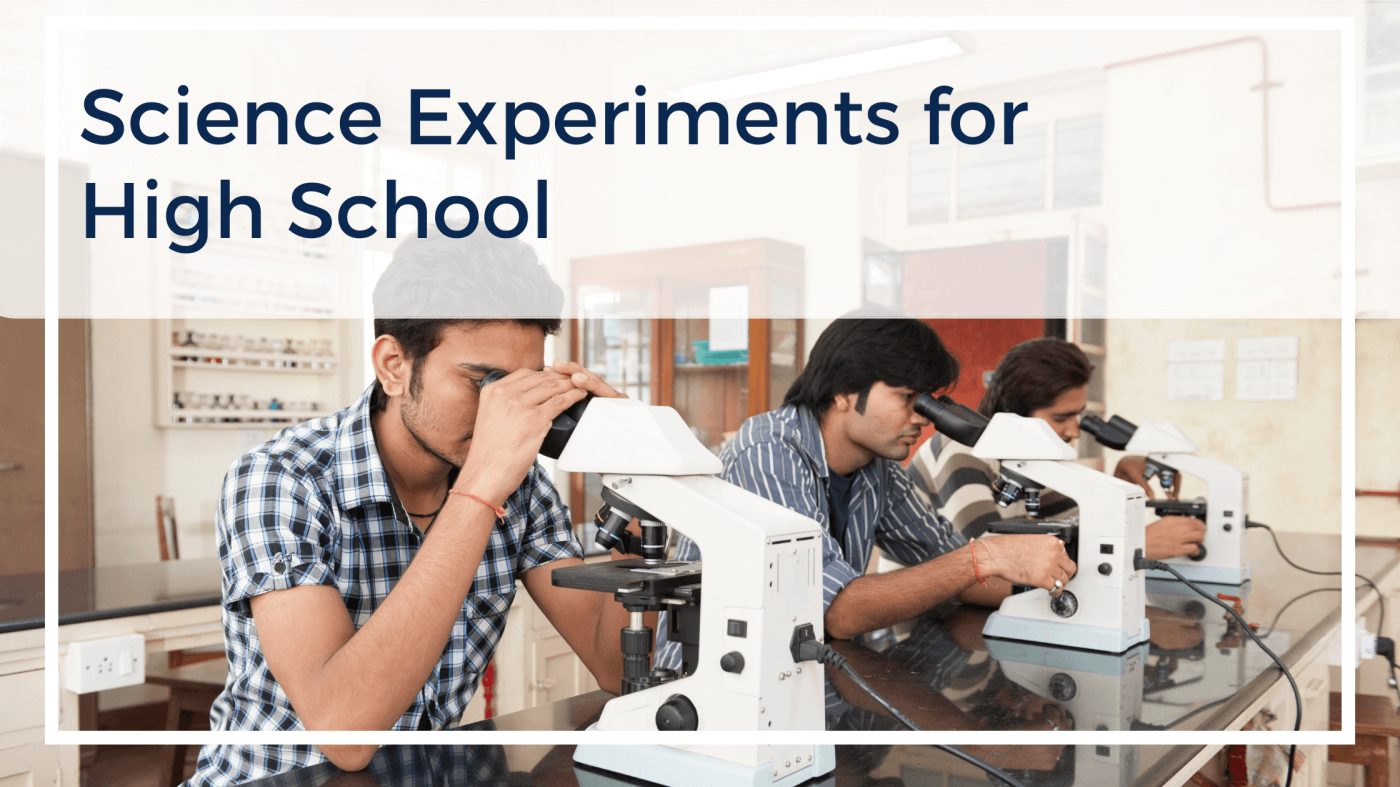
Building models, measuring changes, testing hypotheses…experiments are an engaging way for students to experience scientific concepts instead of just reading about them, and the following units from TERC give students a chance to learn by doing. The units are divided into several labs or modules which delve into complex climate change topics like hydrocarbons' high energy bonds, Earth’s energy balance, the connection between air pressure and wind speed, the effect of ocean acidification on coral reefs, sediment core analysis, and climate history and the cryosphere. These units provide easy-to-follow instructions for meaningful science experiments for high school students.
Each lab contains educator pages and student pages. The educator pages include overviews of the learning objectives, tips and ideas for student notebooks and assessments, and lists of materials needed for activities and experiments. The self-paced student pages lead students through a series of engaging articles, interactive comprehension questions, hands-on experiments, interactive modules, videos, maps, data tables, discussion questions, and detailed glossaries. Sections labeled “checking in”, “stop and think” and “discuss” provide questions to get students thinking critically, making connections, forming hypotheses, and solving mysteries.
Climate and the Cryosphere Unit Labs
Grade: 9th, 10th, 11th, 12th
Subjects: Science, Earth and Space Sciences, Climate Action
Resource Type: Unit Labs
How much do your students know about the cryosphere? This unique unit on climate and the cryosphere consists of six labs that will help students understand how and why Earth’s frozen precipitation plays such a crucial role in maintaining the climate. Below is an overview of each lab:
- Getting to Know the Cryosphere
› This introductory lab gives students the chance to learn about the basics of the cryosphere.
› Students conduct an interesting experiment that measures the effects of albedo.
- Earth's Frozen Oceans
› Students learn about the role of cold water in the oceans and watch a fascinating video on brinicles.
› Students conduct a simple experiment that demonstrates how thermohaline circulation works.
- Land Ice
› Students learn about glaciers and ice sheets and watch a video on the accelerated movement of the Jakobshavn glacier.
› An experiment using homemade silly putty shows students how glaciers move.
- Climate History & the Cryosphere
› Students learn about glacial ages, Milankovitch cycles, and the important role that ice cores play in providing proxy data for climate history. - Evidence of Recent Change
› Students use an interactive tool to compare old photos of glaciers with more current photos.
› Students learn how scientists measure changes in sea ice extent and thickness to understand how the cryosphere is changing.
› Students learn about albedo feedback loops and construct their own Ice-Albedo Feedback Connection Circles.
- Future of the Cryosphere
› Students learn how scientists use climate models to make predictions about the future of Earth’s climate.
› Students use the En-ROADS climate simulator to explore how manipulating certain factors produces different climate scenarios.
› Students design their own model to show how melting land and sea ice cause sea levels to rise.
Climate Detectives Unit Labs
Grade: 9th, 10th, 11th, 12th
Subjects: Science, Chemistry, Biology, Earth and Space Sciences
Resource Type: Unit Labs
How do scientists know about Earth’s climate history? In this engaging unit, students get the chance to join the crew of scientists onboard the JOIDES Resolution, a scientific core-drilling ship, where they will collect and use proxy data from the southern coast of Alaska to learn more about climates of the past. Students will view real video footage of scientists aboard the ship and play the part of climate detectives as they work their way through the six interactive labs. Below is an overview of each lab:
- Preparing for the Voyage
› Students begin by taking a video tour of the JOIDES Resolution and fill out a table describing each area of the ship
› A fun interactive video matching activity helps students learn about the different scientists’ jobs and roles onboard the ship. Students view short video interviews with actual scientists.
› Finally, students learn about why the Gulf of Alaska was chosen for the voyage.
- Coring Is Not Boring!
› Students learn about the technology used to design the ship’s drill, and then use their engineering skills to design and build their own model drill.
› Students test their drills, then modify their designs to improve them.
- Mountains of Ice
› Students learn about glacial activity, including the rapid depletion of polar ice and the impact it is having on the climate.
› Students learn about Milankovitch cycles and how they can change the Earth’s climate.
- Climate Clues from Sand and Mud
› Students learn about types of sediments and how deposition causes dramatic changes in the landscape over long periods of time.
› Students complete a hands-on activity to explore different sedimentation rates.
› Students build models of glaciers to understand how they move sediments as they calve.
- (Geologic) Timing is Everything!
› Students learn how scientists use methods such as superposition and measuring the radioactive decay in certain isotopes to date sediments.
› Using Earth History Timeline Cards, students construct a timeline of Earth’s history. After completing the timelines, students take a closer look at the Miocene epoch, the time period that the JOIDES Resolution is studying during this expedition.
- Analyzing Sediment Cores
› Students learn how scientists examine core samples using a variety of visual techniques. They then examine photographs of sediment cores in order to make observations about the climate in the Gulf of Alaska during different time periods.
› Students learn how scientists use cryogenic magnetometers to measure the mineral contents of the sediment cores as well as microfossils and oxygen isotopes to further analyze the core samples.
› In groups, students use the analysis methods they learned about to analyze the sediment core. They then synthesize the data they collected and prepare a summary of their findings to present to the class.
Corals Unit Labs
Grade: 8th, 9th, 10th, 11th, 12th
Subjects: Science, Social Studies, Chemistry, Biology, Earth and Space Sciences, Geography, Climate Action
Resource Type: Unit Labs
Your students have probably heard that corals have been negatively impacted by climate change, but can they articulate why? This unit gives students a bounty of background information and data and then lets them discover how changes in water temperature and depth as well as the chemical composition of the water make it difficult for corals to survive. Students construct their own coral polyps and use their models for a number of hands-on demonstrations throughout the unit. Below is an overview of each lab:
- Coral Reefs, the Human View
› Students watch a number of fascinating videos on coral biology and coral reef ecosystems and examine real coral samples. - Anatomy of Coral
› Students examine and observe live hydra samples using a microscope, then compare the hydra’s behavior to a video of coral polyps. Students learn about the symbiotic relationship corals have with zooxanthellae algae.
› Students build models of coral polyps that demonstrate how corals obtain nutrients.
- Building a Reef
› Students do an experiment that demonstrates how corals build their skeletons.
› After learning about how corals reproduce, students work in groups and use their coral models from Lab 2 to model coral reproduction.
- Finding Coral's Ideal Environment
› Students use maps and data to determine the connection between ocean temperature, ocean depth, salinity, aragonite concentration, and coral reefs. - Trouble in Paradise: Factors that Impact Coral Health
› Students use Google Earth to discover how watershed pollution, exploitive fishing, coastal development, and physical damage are threatening coral reefs around the world. - Using Data to Identify Hot Spots and Predict Bleaching Events
› Students learn about coral bleaching and work in small groups to design a way to use their coral models to show how coral bleaching occurs.
› Students use current data from the NOAA to identify hot spots where coral bleaching is likely to occur.
› Finally, students use their new knowledge to examine data from the Florida Keys Reef to determine the impacts of climate change on the corals.
Hurricanes Unit Labs
Grade: 9th, 10th, 11th, 12th
Subjects: Science, Social Studies, Chemistry, Physics, Earth and Space Sciences, Geography
Resource Type: Unit Labs
Does it seem like hurricanes are becoming more intense? That’s because they are! This unit helps students to understand why hurricanes are producing more rain and higher winds. With a combination of real hurricane data and tons of hands-on experiments, students will gain a deep understanding of how and why hurricanes form, and will discover what that means for the future of coastal regions. Below is an overview of each lab:
- Meteorological Monsters
› The lab starts with an inquiry-based activity in which students view satellite footage and try to determine where and why hurricanes form and why there is a distinct pattern to the way they travel across the Earth. - Hurricane Anatomy
› Students learn about the Saffir-Simpson scale and how NASA uses satellites to measure the sea surface temperature and sophisticated climate models to predict the size and strength of hurricanes.
› Students compare and contrast cyclones and hurricanes.
- Putting Hurricanes on the Calendar
› Students use the HURDAT2 database to understand more about the records that NOAA keeps on hurricanes, and they practice interpreting the data and looking for patterns.
› Students use data to determine when hurricanes occur each year.
- Putting Hurricanes on the Map
› Students use real hurricane data to plot the course of a hurricane using Google Earth. Then, they look at where the hurricane was located when the greatest rainfall occurred. Students also look for connections in the data between the storm’s wind speed and air pressure.
› Students use the NOAA’s site to see if their local area has been impacted by a hurricane.
- All About Air Pressure
› Students rotate through a series of five stations to complete a collapsing soda can experiment, a balloon in a jar experiment, a ruler and a newspaper experiment, an egg in a bottle experiment, and a soda bottle and ping pong ball experiment to learn about the force of air pressure. - Why Keep an Eye on the Barometer?
› Students use Hurricane Katrina as a case study and try to determine when the hurricane developed hurricane-strength winds by graphing data on air pressure and wind speed. - Hurricanes and Heat Transfer
› Students learn about how warm water affects hurricanes by completing experiments on Adiabatic expansion and convection cells.
› Students learn how to measure the humidity in the air by building a simple wet-bulb dry-bulb thermometer. Afterwards, they build an apparatus to measure the dew point using the condensation method and compare the results of the two methods.
› Students evaluate sea surface temperature maps from before and after a hurricane and determine how much water was cooled by the hurricane.
- Hot Water and Hurricanes
› Students learn about specific heat and the Gulf Stream and calculate how much energy water absorbs when it gets warmer. - Death and Destruction
› Students learn about the effects of hurricanes on people and property and discover how to prepare for a hurricane.
The entire blog post can be read at Subject to Climate with a full breakdown of every EarthLab unit.
 SubjectToClimate envisions a world where everyone feels empowered to take action in solving climate change. To create this future, climate action begins in the classroom. Our work centers around two primary programs: connectors and integrators. We connect educators to resources, and we collaborate with localized stakeholders to integrate our platform to their needs.
About the Author
Emily Rogers has a bachelor’s degree in English and French and a master’s degree in library and information science. She spent seven years teaching information evaluation and research skills as a school librarian in K-8 public schools. As a lifelong resident of Southern Louisiana, Emily has a particular interest in how climate change affects coastal regions. She hopes to connect educators with resources that will help them to teach their students about the disproportionately adverse effects of climate change on historically marginalized communities.